Why NASA converted its lessons learned database into a knowledge graph
Learning from mistakes—your own and those made by others—is a mark of effective organizations. Fostering a learning environment means seeing every possible outcome as a learning opportunity. And every project manager knows the importance of documenting and continuously reviewing these lessons learned.
Many companies maintain databases for their lessons learned which contain heaps of valuable information, potentially critical to the success of new projects. More often than not, though, they are incredibly difficult to search and navigate, rendering them unusable.
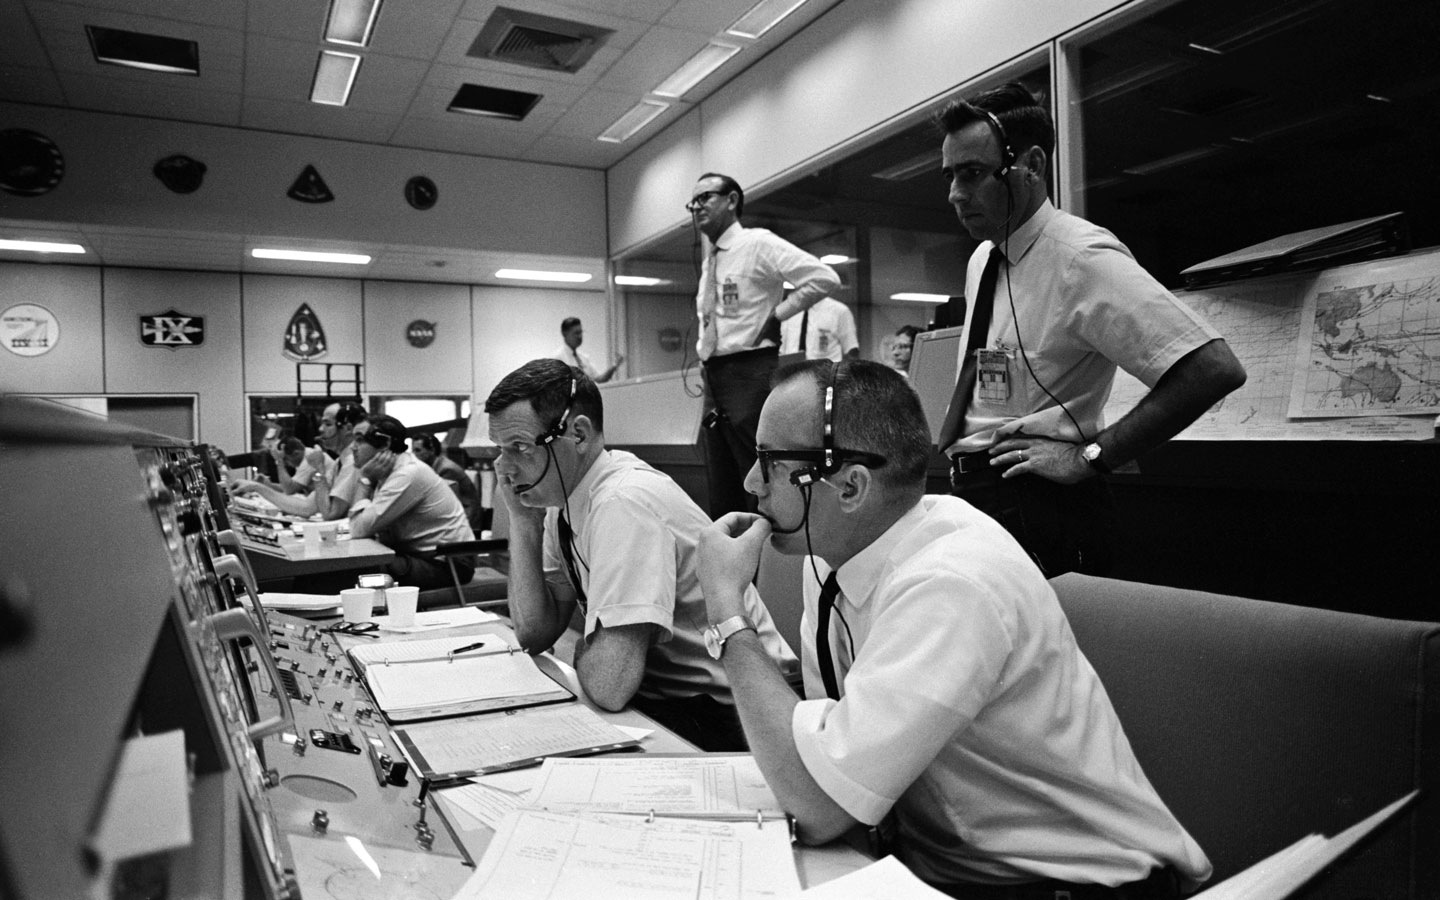
Houston, we erased the Apollo 11 tapes
Even mature and knowledge-driven organizations like NASA find themselves struggling to find the answers they need in their own knowledge bases. Nothing illustrates that better than the infamous case of the "lost tapes", as they came to be referred to by the press.
In the early 2000s, a team of retired NASA employees set out on a search after the tapes containing the original footage of the Apollo 11 moonwalk by Neil Armstrong and Buzz Aldrin. After an exhaustive, three-year search, NASA was forced to admit to an embarrassing mishap: the tapes were most likely improperly labeled and ended up being erased and reused at some point in the 1980s.
While this case is certainly an outlier, it does reflect the challenges that come with managing knowledge. NASA famously maintains an automated database called the Lessons Learned Information System (LLIS). It contains impressive volumes of data collected from past tests and missions, both successful and failed, and is used in the planning of future projects and expeditions into space. As the database absorbed more and more information, it became apparent to NASA that in order to maintain its usability the system needed to be modernized.
Visualizing knowledge
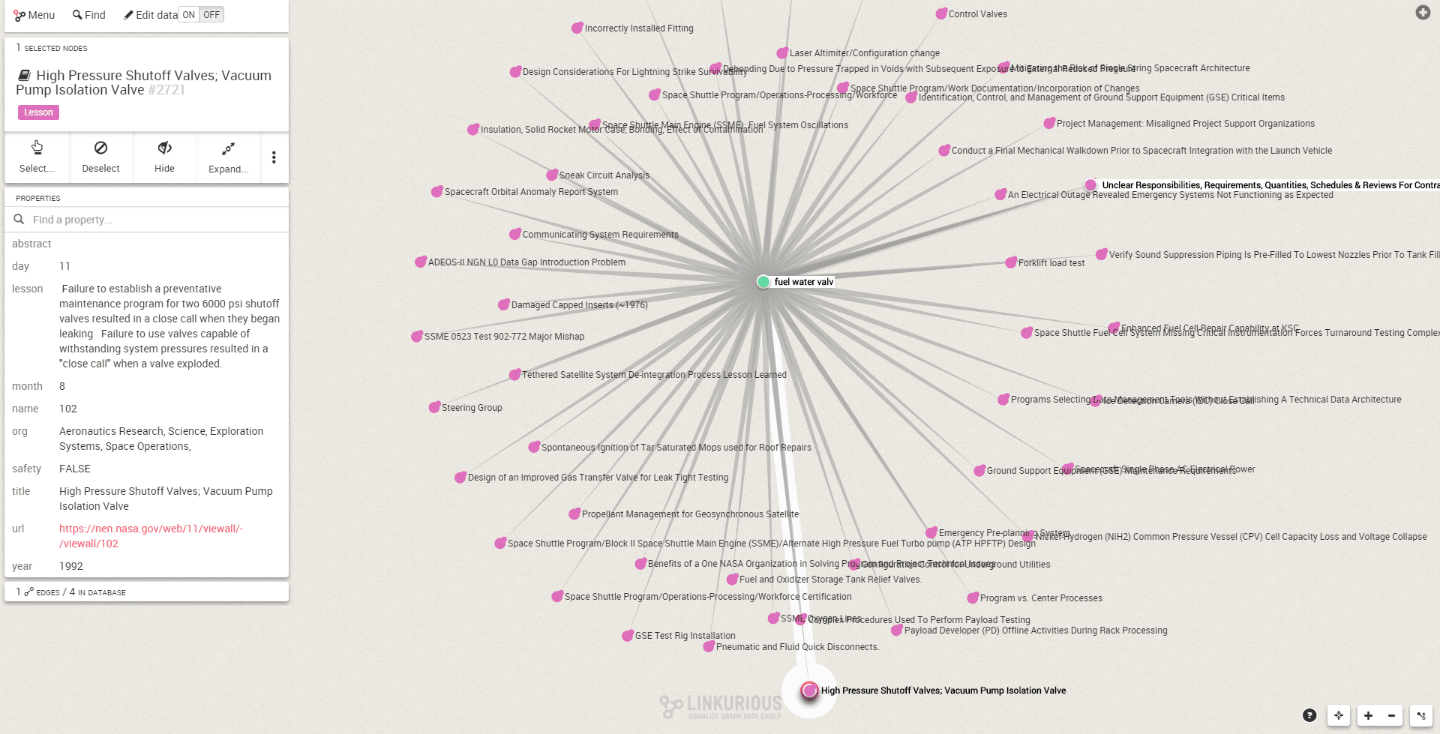
Collecting and storing the lessons learned is only half the battle. Making that knowledge easily discoverable is the real challenge. David Meza, NASA’s Chief Knowledge Architect understood this all too well as he struggled to find answers in LLIS. The system required you to punch in a keyword which would then produce an endless, randomly arranged list of links to documents, every one of which needed to be checked one by one—a process so tedious that NASA engineers hardly ever consulted the system.
Meza saw the tremendous potential in the database and embarked on a mission to unlock it. He began by experimenting with networks and graph databases. Each individual lesson learned became a node in the network, clustered around a relevant topic using a machine learning algorithm. That data was then stored and organized using the database system Neo4j, and a graph visualization was used to visualize the connections between the clusters. This approach allowed users to explore the data in a new, intuitive way, reducing the time they needed to find answers.
The new approach immediately yielded positive results. In 2014, when a team of NASA engineers was working on Exploration Flight Test-1, an unmanned mission to send the Orion spacecraft into orbit, they discovered that Orion's uprighting system wasn't working correctly. Knowing that Apollo used a similar uprighting system to Orion, the team turned to the NASA lessons learned database. An 8-day search turned up only 3 relevant documents, none of which helped them solve the problem. In desperation, the team reportedly even visited retired Apollo astronauts at their homes to see if they had any useful documents stashed away in their attics.
Meza and his team came to the rescue, discovering over 30 relevant files in the database, which ultimately helped NASA find a solution to Orion's uprighting system problems. Without that information, the team would have had to spend years and millions of dollars testing different designs, delaying Orion's 2023 launch even further.
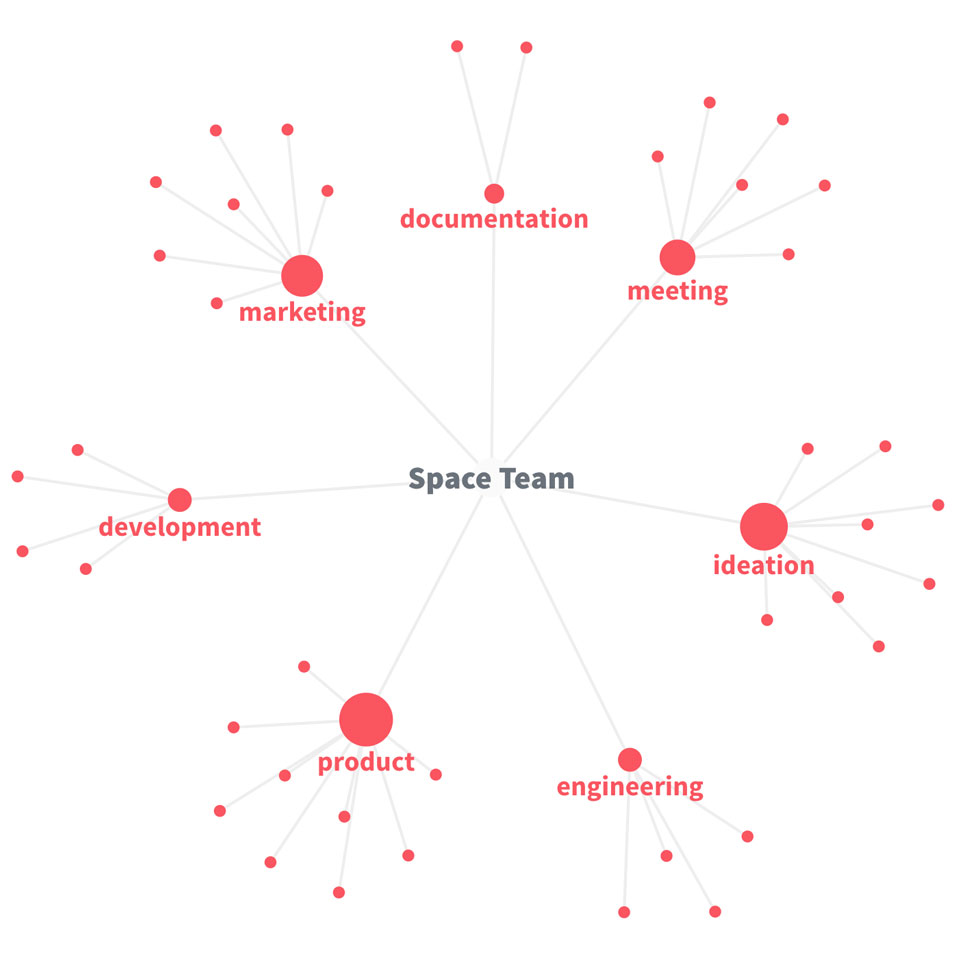
Nuclino follows NASA's approach to knowledge management. A lessons learned database is only useful when the information it contains can be easily found and accessed, making an intuitive, visual interface a critical component of the system. The graph view in Nuclino organizes your knowledge in a mind map with topic clusters, giving you a visual overview of the whole database and making it easy to identify information relevant to your topic or project.
Even if your lessons learned database doesn't span decades it can easily swell and drown you in information. Experience shows that the deciding factor between the success and failure of a project is not the volume of knowledge at your disposal, but rather its discoverability. When done right, a lessons learned database can tremendously reduce your time to find answers and allow you to start your project on the right foot.