Introducing the new and improved graph view

Take a first look at the enhanced graph view in Nuclino! We've reviewed your feedback and implemented a series of improvements to make the graph clearer, faster, and easier to explore, even when your workspace has a lot of content.
Better graph layout and navigation
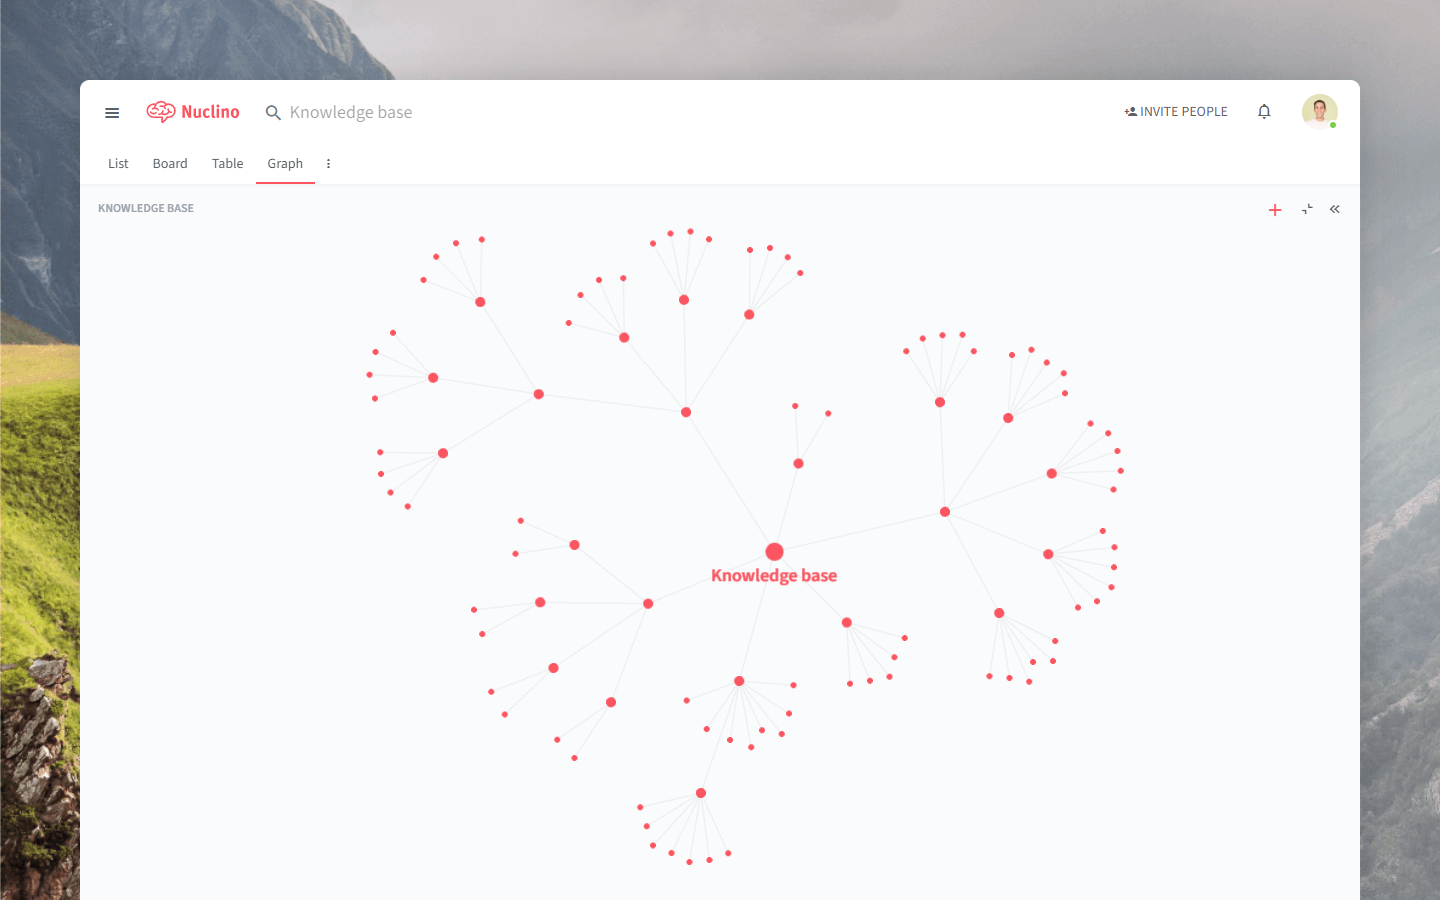
The graph view provides a bird's-eye view of your entire workspace, allowing you to quickly grasp its structure. But when you have a lot of nested collections and items, it may become harder to navigate.
Now, we have completely revamped the default graph layout so that it automatically adjusts to the amount of content in your workspace, maintaining a clear and coherent structure.
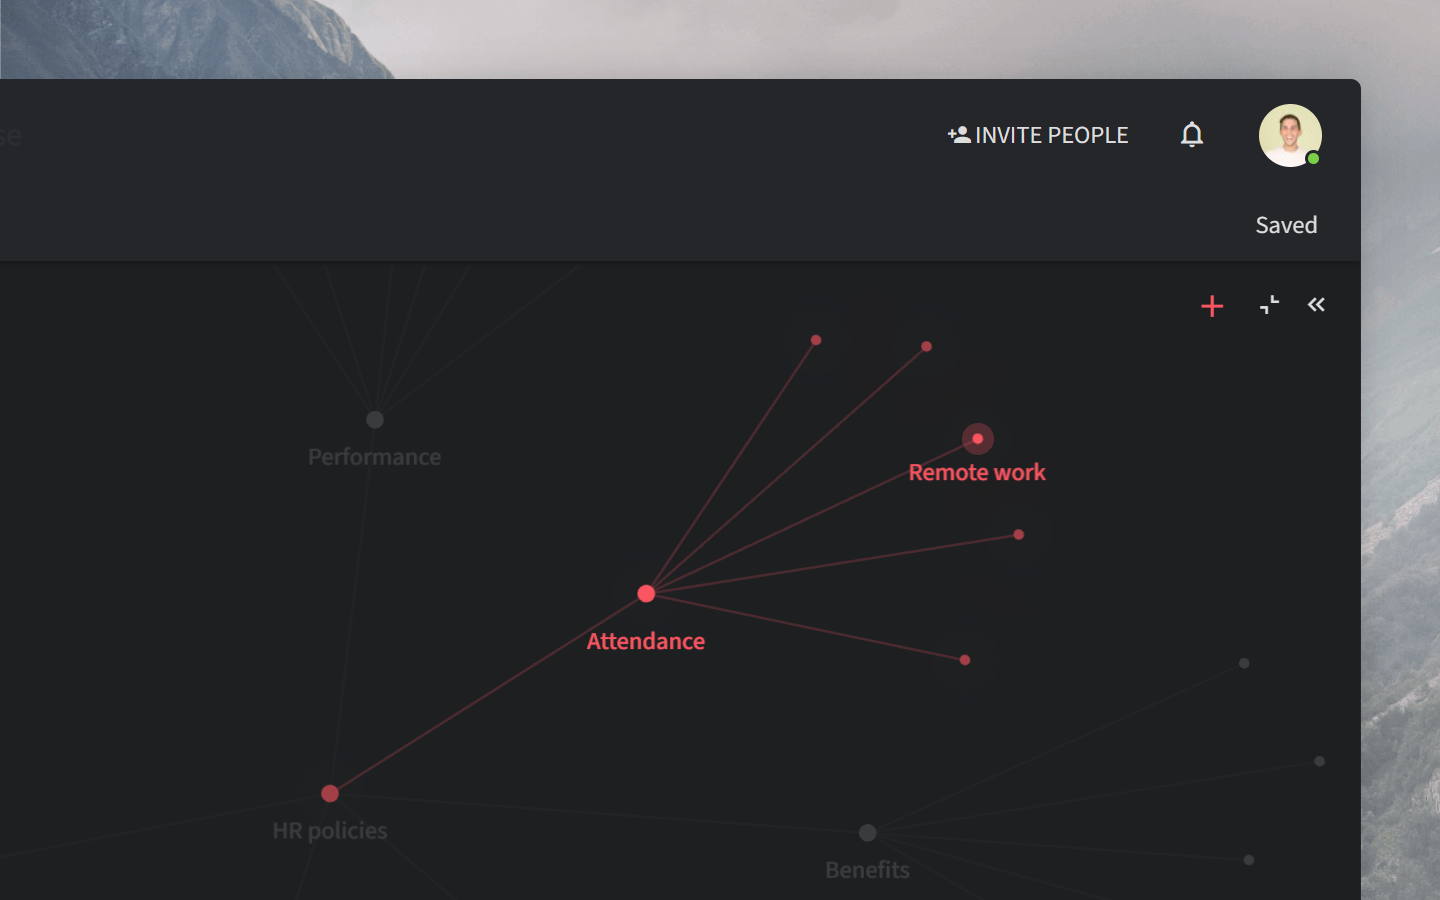
As you navigate through your workspace in the graph view, you'll notice some new visual cues that make your interactions more intuitive and engaging.
When you move your mouse over different dots representing items and collections, the graph will change color to highlight them. When you select an item or a collection, it responds with a subtle yet noticeable pulsating animation, drawing your attention and making it easier to focus on it, especially when you're in a workspace with a lot of content.
Improved performance
The graph view now handles large workspaces with ease. We've significantly improved the performance, making the graph load faster and respond more promptly to your interactions – even when you're working with thousands of items and collections.
Zoom out for overview, zoom in for details
The graph view now adapts based on your zoom level. When zoomed out, the collection and item titles are hidden to provide a clean, uncluttered view. As you zoom in, the titles appear, offering more detailed information. This allows you to get a clear high-level overview and makes it easy to drill down into specifics if needed.
Easy-to-read labels
To improve readability and maintain a clean, organized view, lengthy titles are now automatically shortened, so you can navigate the graph without being overwhelmed by text.
We've also standardized the size of labels across different zoom levels. Whether you're zoomed in for a detailed look or zoomed out for a broader overview, the size of the labels now remains consistent to provide a uniform, comfortable reading experience.
We hope these updates make your experience with the graph view more efficient and enjoyable. Give it a try and let us know what you think!